Dive In!
Exploring The Charles River's Health

If you live in Boston or Cambridge, you’re likely familiar with the
Charles River
You may have visited the Charles River’s parks, walked or cycled along its paths, or even kayaked through its waters…
Since the 1980’s, E. coli levels and fecal coliform levels (another indicator of sewage contamination) have decreased dramatically over time.
Explore the average levels E. coli measured for each year since 1989 by hovering over the bar chart, and explore how E. coli levels have changed at specific water testing sites by clicking or brushing over their locations along the river.
CSOs ![]()
Dramatic decreases in E. coli levels can be attributed to the near elimination of combined sewage overflows (CSOs) into the Charles.
Explore some of the major infrastructure improvement projects that led to reductions in CSOs entering the Charles River by hovering over the chart.
CSOs occur when combined sewer systems, which collect both domestic sewage and rainwater runoff, exceed their capacity. Instead of transporting the wastewater to a treatment plant, the untreated mix gets discharged directly into nearby bodies of water. Though this practice was previously commonplace in Boston and Cambridge, a 1984 ruling under the Clean Water Act mandated a program to protect Boston Harbor from sewer system pollution. CSO reduction efforts began shortly after.
Precipitation
E. coli levels fluctuate rapidly in the Charles River, and much of this variation is caused by large rain events. Stormwater run-off can wash bacteria into the river, and on occasion large rain events still trigger combined sewer overflows, which discharge untreated sewage into the Charles.
During the summer of 2018, Northeastern Ph.D. Candidate Max Rome sampled the Charles River at North Point Park in Cambridge for E. coli (almost) every day. Using this interactive chart, explore the days that surpassed state regulations for swimming (which pertain to both daily and 5-day average measures) and how they coincide with rain and wet weather days.
Every summer, cyanobacteria blooms exceed levels safe for recreational water activity.
The Charles River Watershed Association measures the river water weekly during peak bloom season, and if cyanobacteria levels exceed state guidelines, the Massachusetts Department of Public Health (MDPH) recommends that public advisories be posted for the duration of the bloom.
The MDPH has posted 11 advisories restricting recreational water use for an average of 48 days each year since 2009. Since then, the Lower Basin of the Charles River has had cyanobacteria blooms that have lasted from 2-13 weeks every summer, resulting in dangerous swimming conditions for extended periods of time.
Hover over the bar chart to see how often excessive cyanobacteria levels have made the Charles River unsafe to swim in during summer months.
Hot Summer Days
Cyanobacteria grow best in water temperatures above 25°C, or 77°F. This means that cyanobacteria levels are highest during the hot summer months, which unfortunately overlaps with the swimming season in Massachusetts.
Cyanobacteria blooms can be measured by two indicators:
Chlorophyl A: a chemical that cyanobacteria produces
Phaeophytin: a chemical released when cyanobacteria die
These nutrients have been measured quarterly for several years and tend to be highest when water temperature is also high. Click below to see the correlation between these cyanobacteria indicators and water temperature.
Since cyanobacteria blooms rely on the presence of excess nutrients like phosphorus, efforts to control blooms have consisted of limiting nutrient runoff from entering the river. Thanks to the work of Massachusetts DEP and the EPA, average yearly phosphorus levels have decreased steadily over the past couple decades.
How do you think summer mean Chlorophyl A levels (an indicator of cyanobacteria growth) changed during this time period as a result of decreases in phosphorous levels?
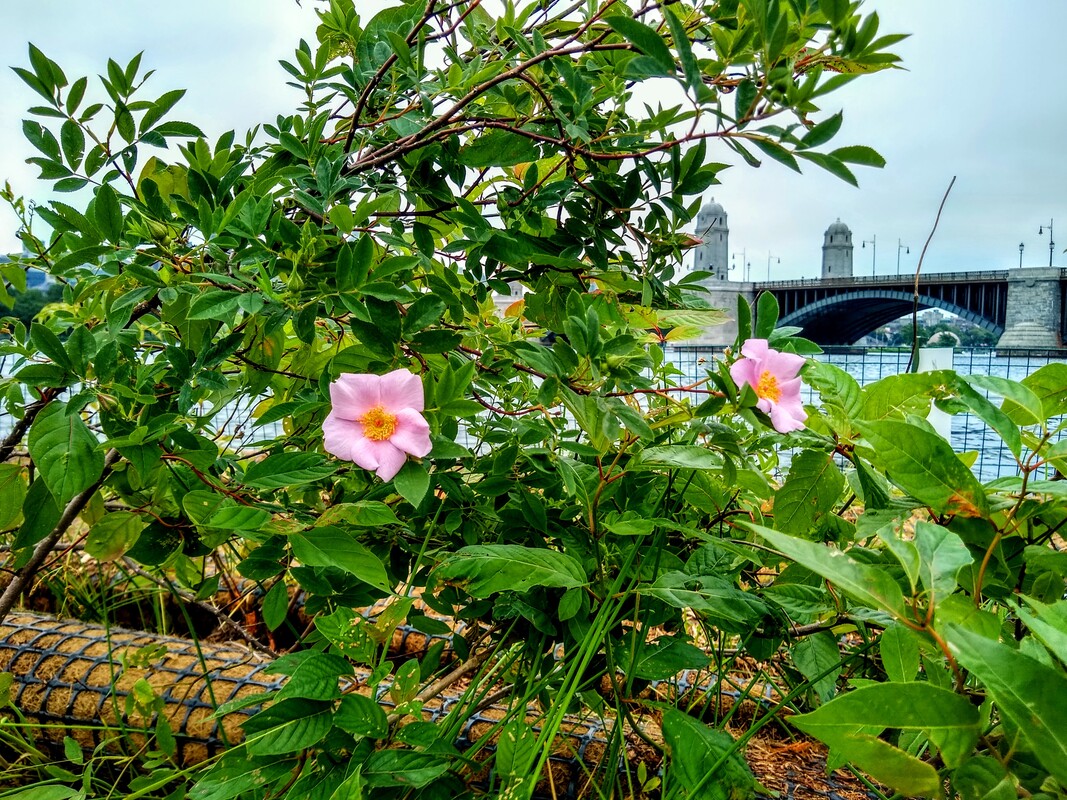
Wetlands of Past & Present
Since decreasing levels of nutrient pollution have not always translated into reductions in cyanobacteria, researcher Max Rome and the Charles River Conservancy are exploring how the river's ecology and history could play a role in developing alternative approaches. The Charles River today looks much different than it did in the past, and that could be part of the problem. Before European colonization, the Charles River was a tidal estuary, surrounded by wetland marshes that supported diverse plant and aquatic life. During the 19th century, the wetlands were drained and in many places the natural river's edge was replaced with concrete walls. Explore the diagram to the left to learn what the geography of the river looked like!

How could a floating wetland help?
Though the overgrowth of cyanobacteria can be attributed to excess nutrients like phosphorus, it can also be understood as the result of a broken food chain. Zooplankton are tiny aquatic organisms that eat cyanobacteria. If populations of zooplankton were more robust, we might see fewer cyanobacteria blooms in the summer.
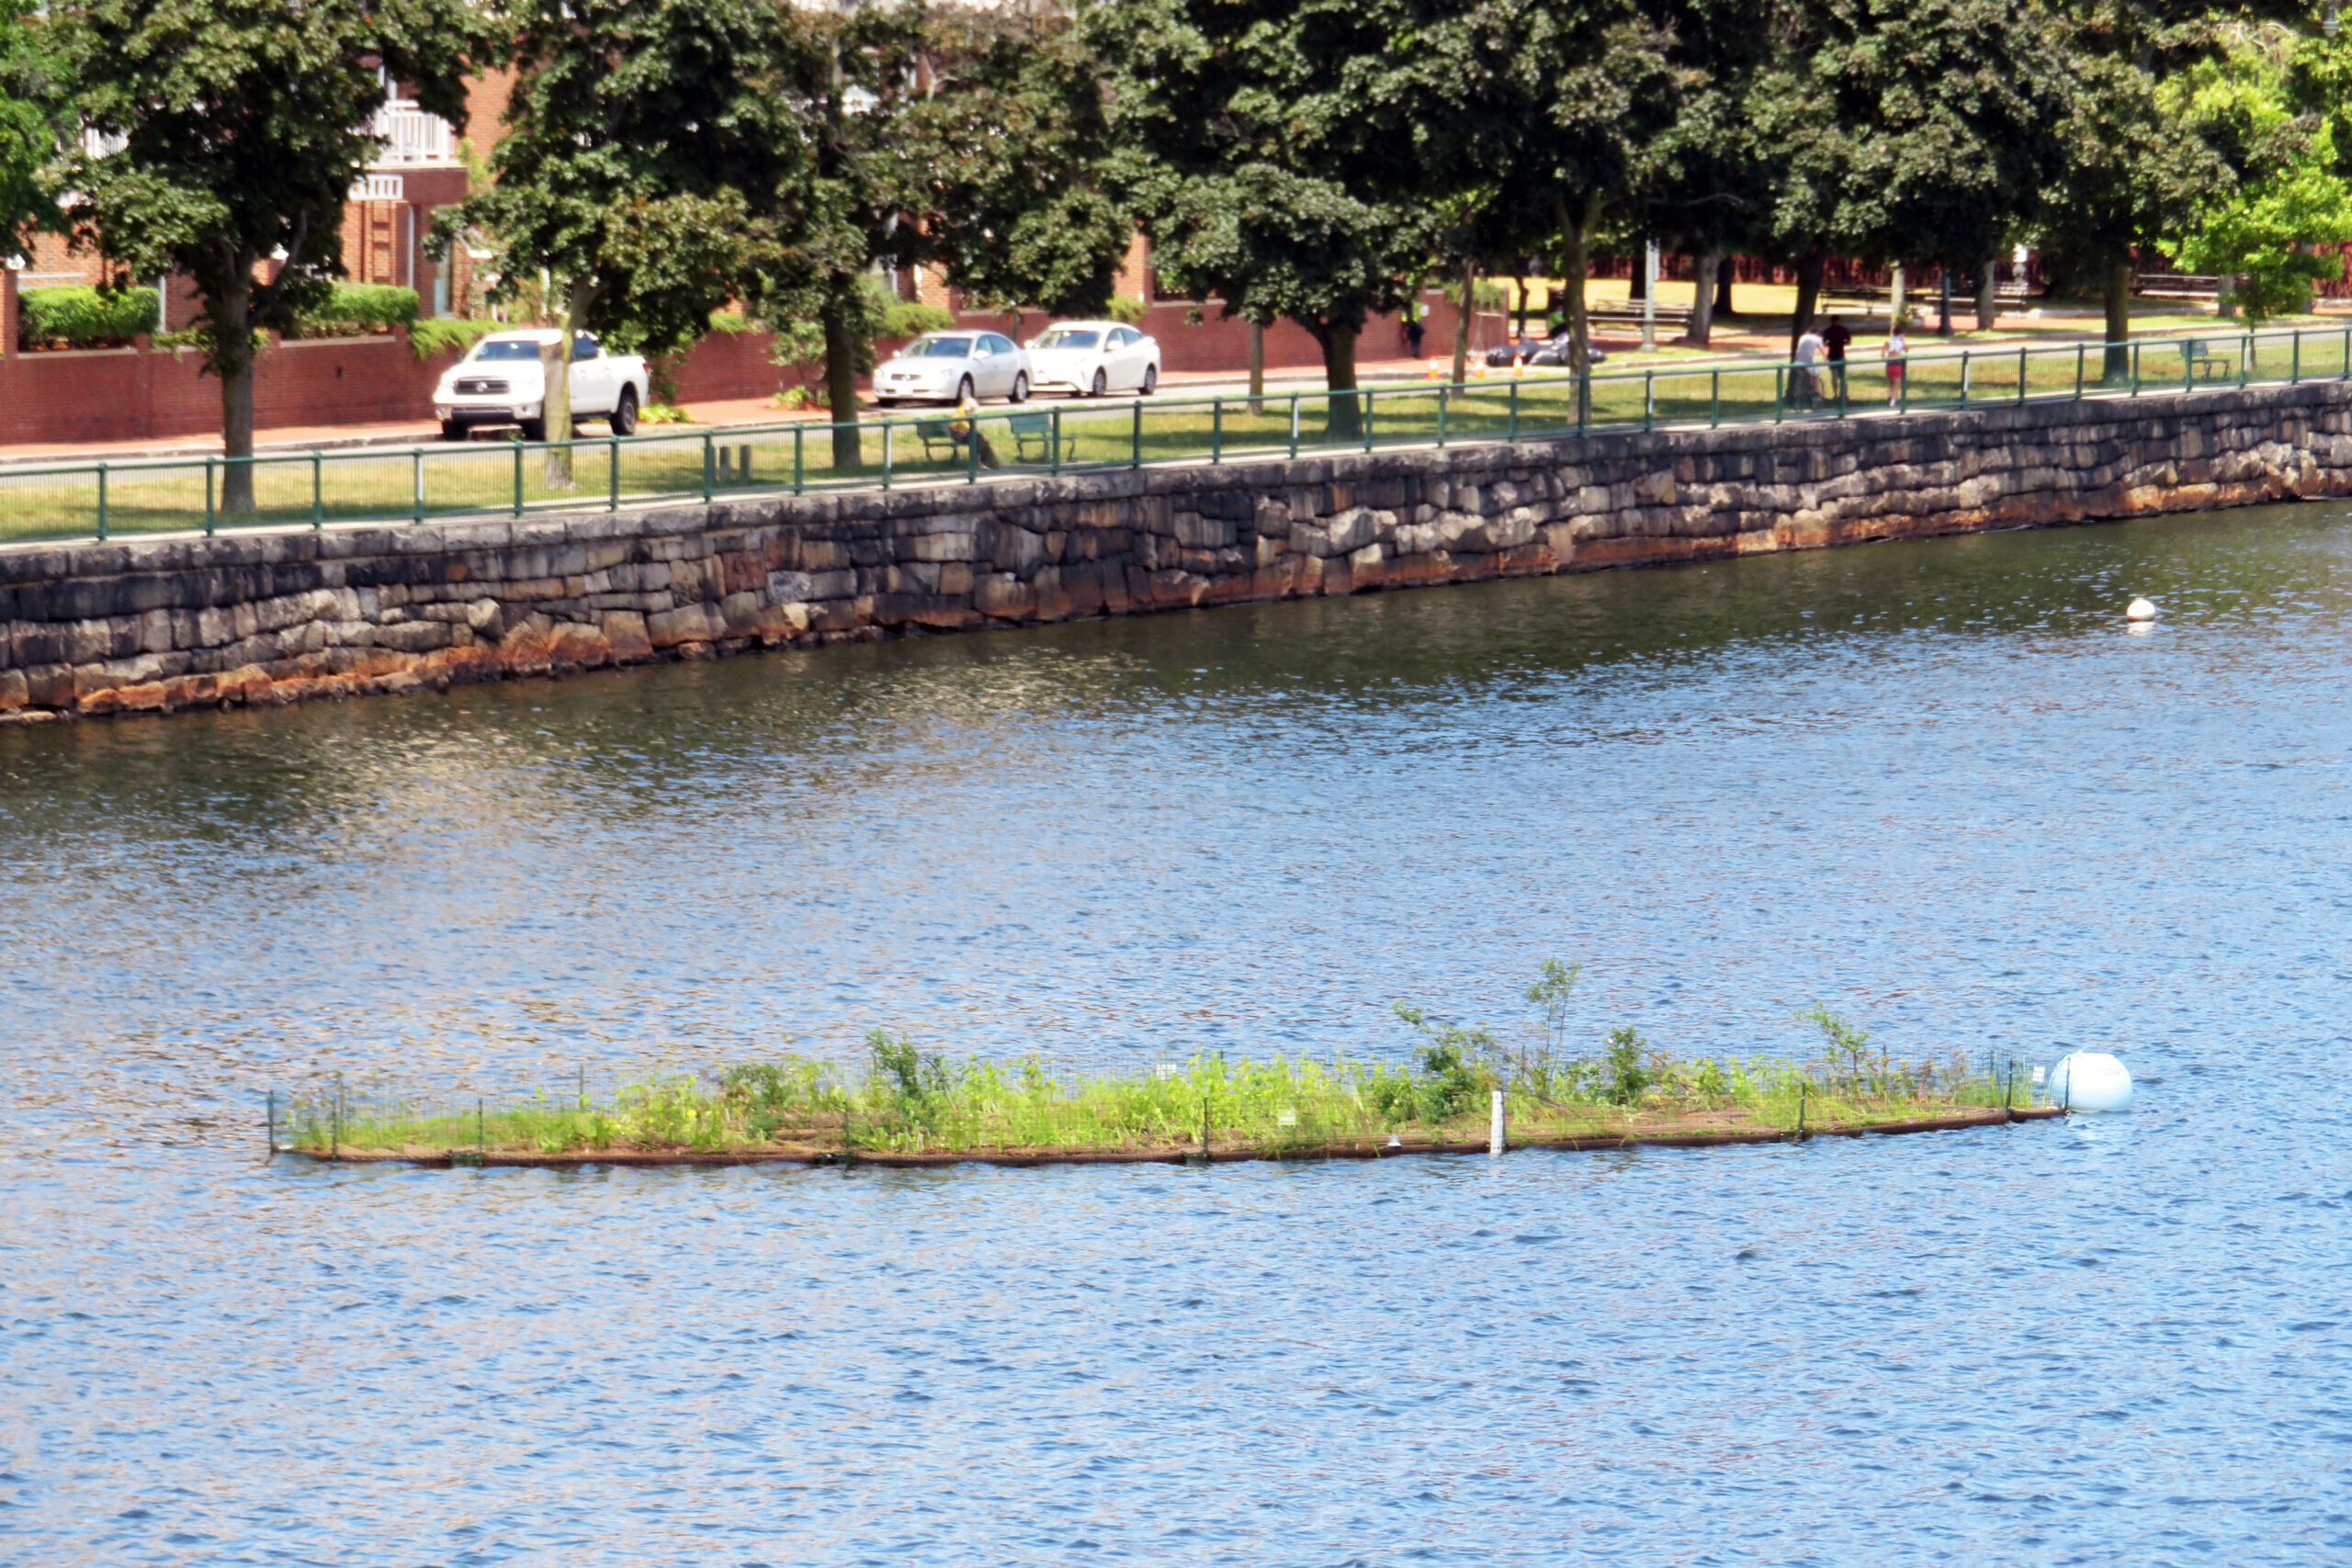
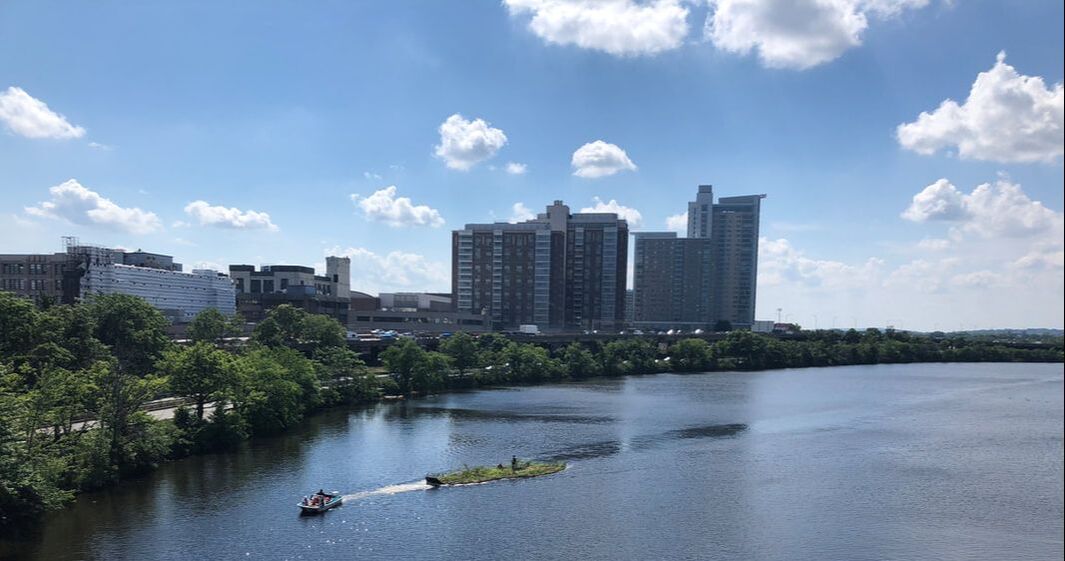
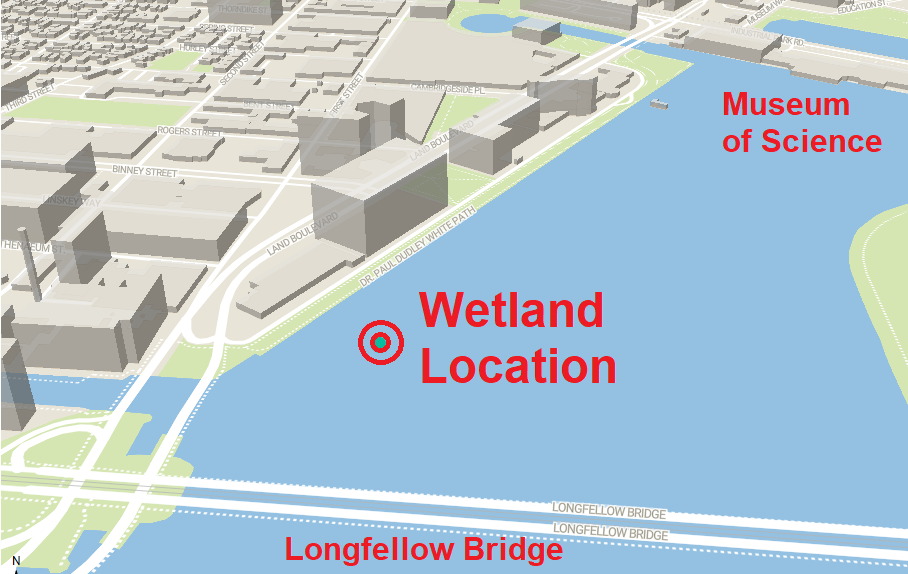
In partnership with the Charles River Conservancy, Northeastern University Ph.D. Candidate Max Rome has installed a floating wetland into the Charles River, just downriver of the Longfellow Bridge near the mouth of the Broad Canal. The hope is that introducing this new habitat will shield cyanobacteria-eating zooplankton from its predators, small fish. Since much of the river’s natural bank has been replaced by the construction of walls, the floating wetland’s root system will provide crucial new refuge for zooplankton and could help restore balance to the river's broken food chain.


Acknowledgements


We would like to thank Professors Hanspeter Pfister, Johanna Beyer, and the CS171 teaching staff for their instruction and guidance. Special thank to our TF, Robert Roessler for his wisdom and hard work - we cannot thank you enough! We would also like to thank Max Rome for graciously granting us access to his data on water quality in the Charles. Thanks to David Bender for his input on our site graphics!
>
Sources
Data
Live Water Quality Data - Individual Parameter for the Lower Charles River
Water Quality Reports and Data
Annual Report Cards
1999 Annual CSO Report
Environmental Monitoring Data from Boston Harbor & Tributary Rivers
Literature
https://en.wikipedia.org/wiki/Dirty_Water
https://www.wbur.org/news/2017/07/18/bostonians-swim-charles-river
https://www.epa.gov/charlesriver
https://thecharles.org/city-splash/
https://www.wbur.org/news/2017/09/08/charles-river-water-quality-swimming
https://extension.arizona.edu/sites/extension.arizona.edu/files/pubs/az1624.pdf
http://sitn.hms.harvard.edu/flash/2019/charles/
https://www.epa.gov/npdes/combined-sewer-overflows-csos
https://www.crwa.org/promote-resilience.html
https://www.wcvb.com/article/love-that-dirty-water-epa-grades-charles-river-water/27961470#
https://www.crwa.org/uploads/1/2/6/7/126781580/cyanobacteriafactsheetfinal.pdf
https://www.wbur.org/news/2017/09/08/charles-river-water-quality-swimming
https://www.crwa.org/monitor.html
https://www.charlesfloatingwetland.com/water-quality.html
https://www.clf.org/blog/charles-river-swim-cancelled-stormwater-pollution/
https://cees.iupui.edu/research/algal-toxicology/...
https://www.epa.gov/nutrientpollution/climate-change-and-harmful-algal-blooms
"https://www.crwa.org/charles-river.html#Challenges
https://thecharles.org/floating-wetlands/